Professional / System & UI
Data Visualization
While working on a supplier-side design system for Expedia Group, I led the effort to establish foundational data visualization styles. In order to demonstrate the work without releasing confidential proprietary information, I’ve recreated the styles and direction in a more generalized format. These are examples that might guide a team wishing to create objective, unbiased data visualization charts.
Focused on clarity
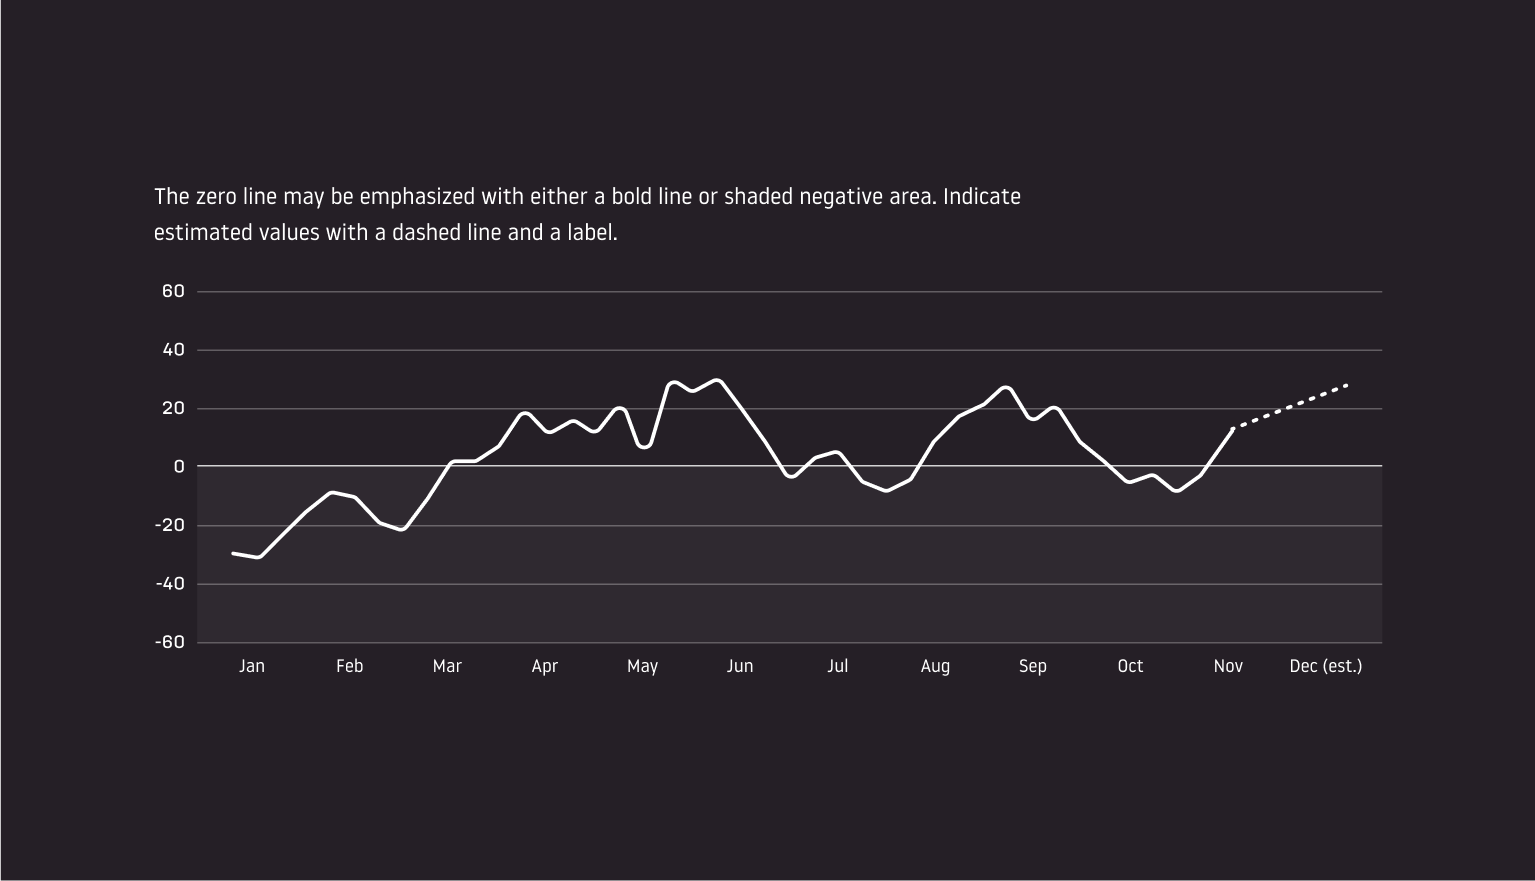
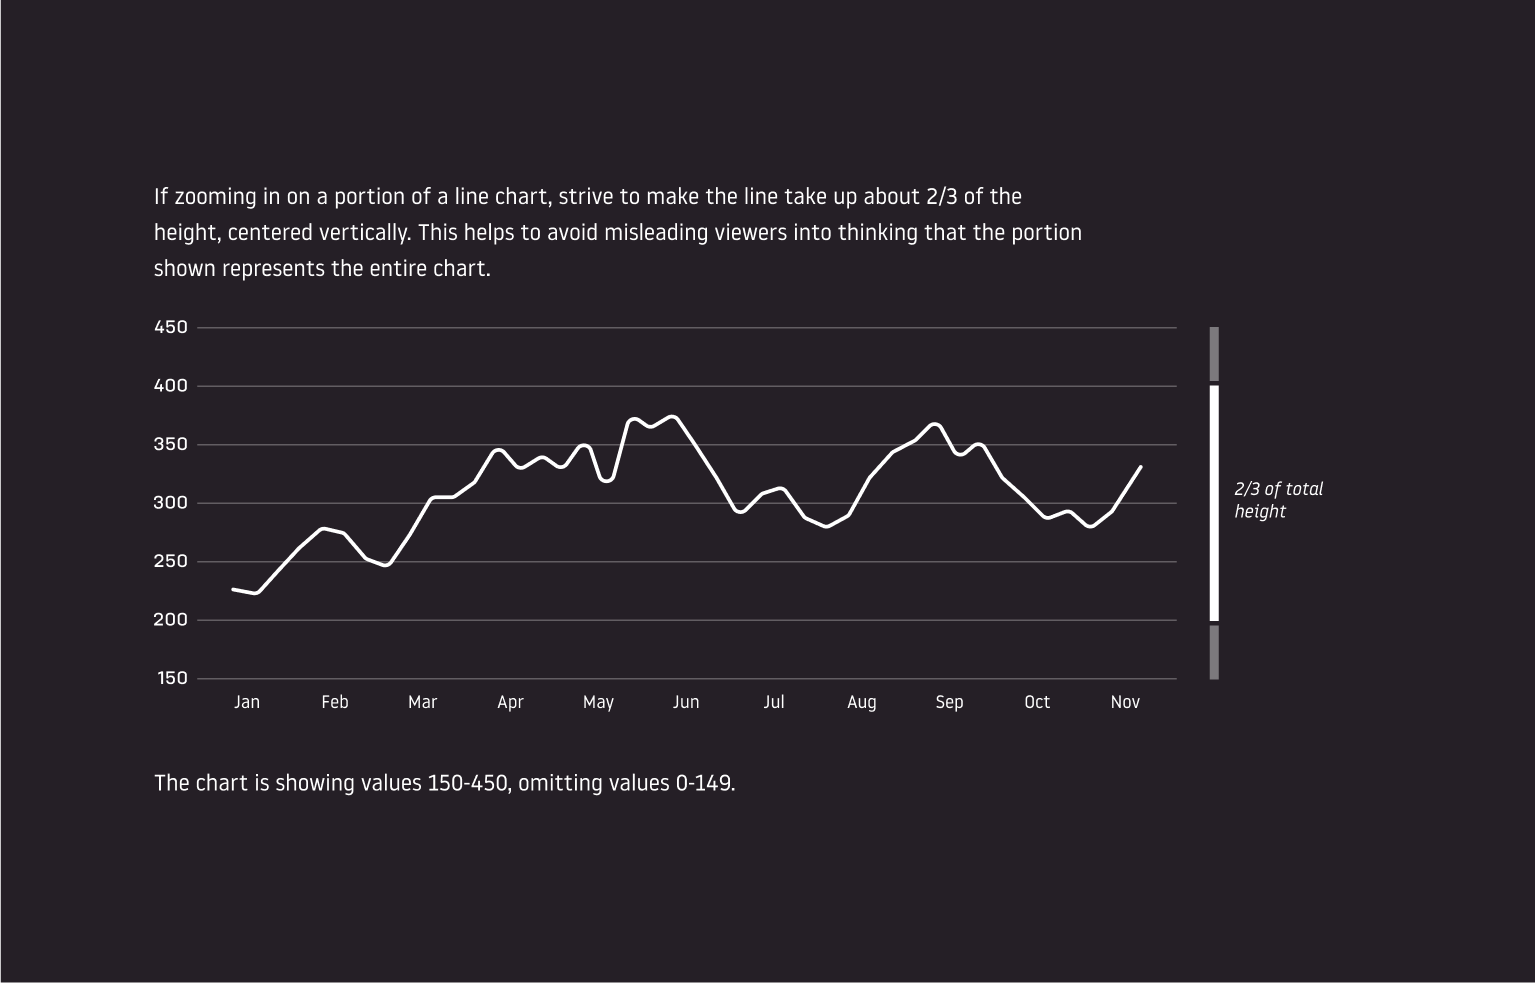
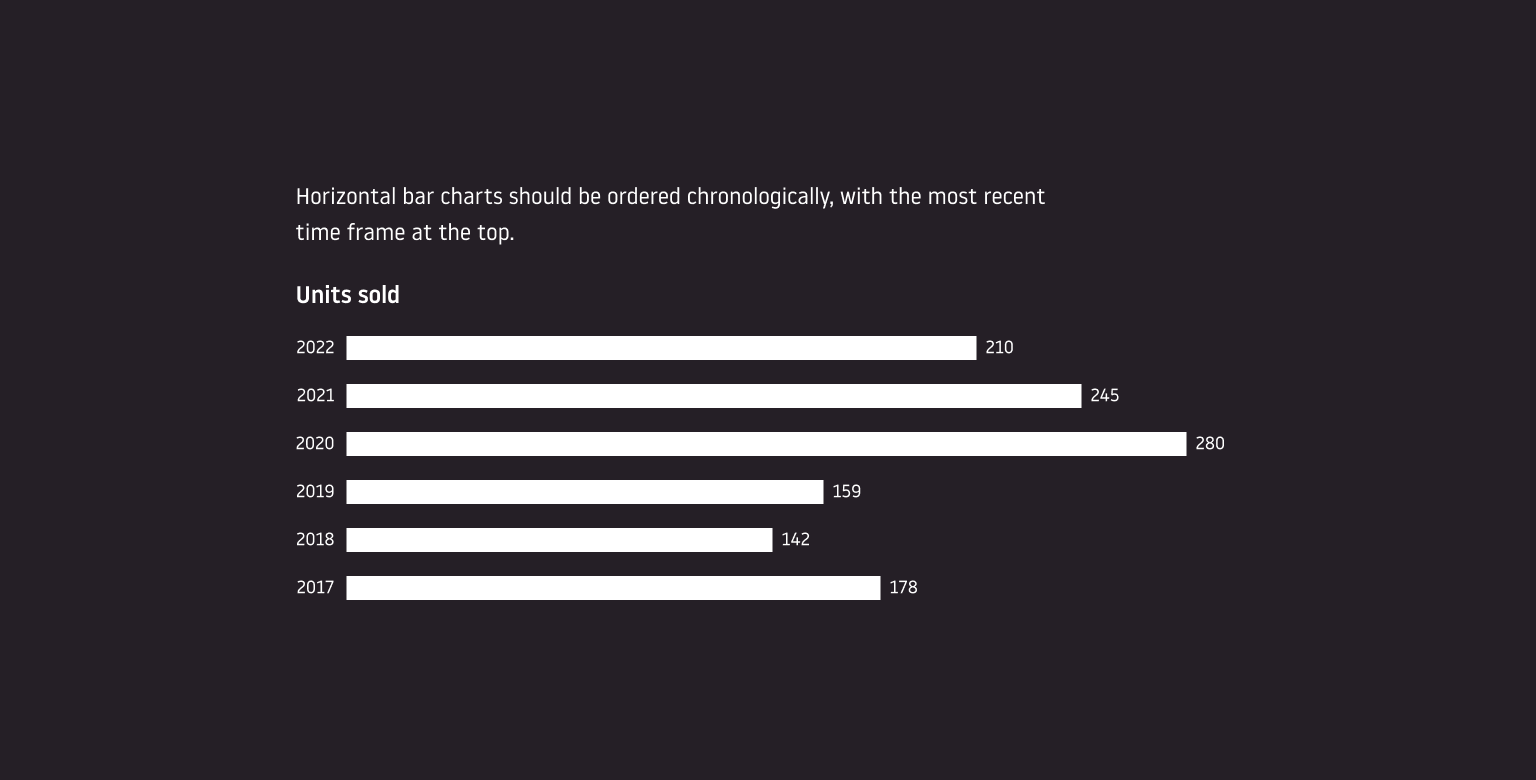
I believe the best guidance we could give teams looking to visualize data is on how to do so without misleading or obfuscating. This means leaving out unnecessary embellishments, being careful to follow established norms regarding the zero line and negative values, how to crop in on a portion of the full scale, focusing in on exactly what you want to show and not combining multiple jobs, things like that. You could write a book covering all this, and of course, people have. My job was to distill the information into guidelines that didn’t take weeks to read while still conveying the most crucial information.
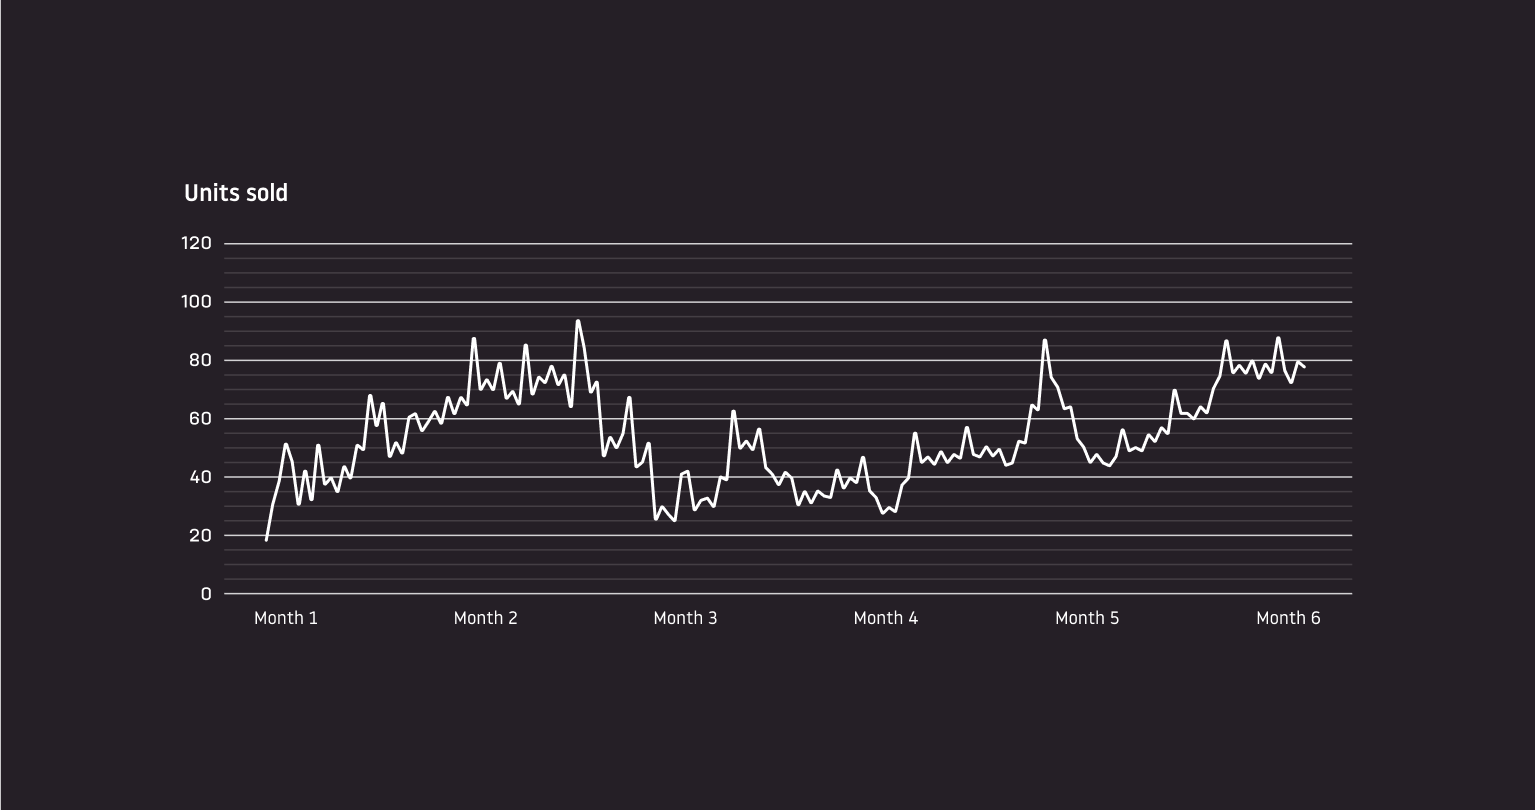
Following are examples of the information covered.
Accessibility and color
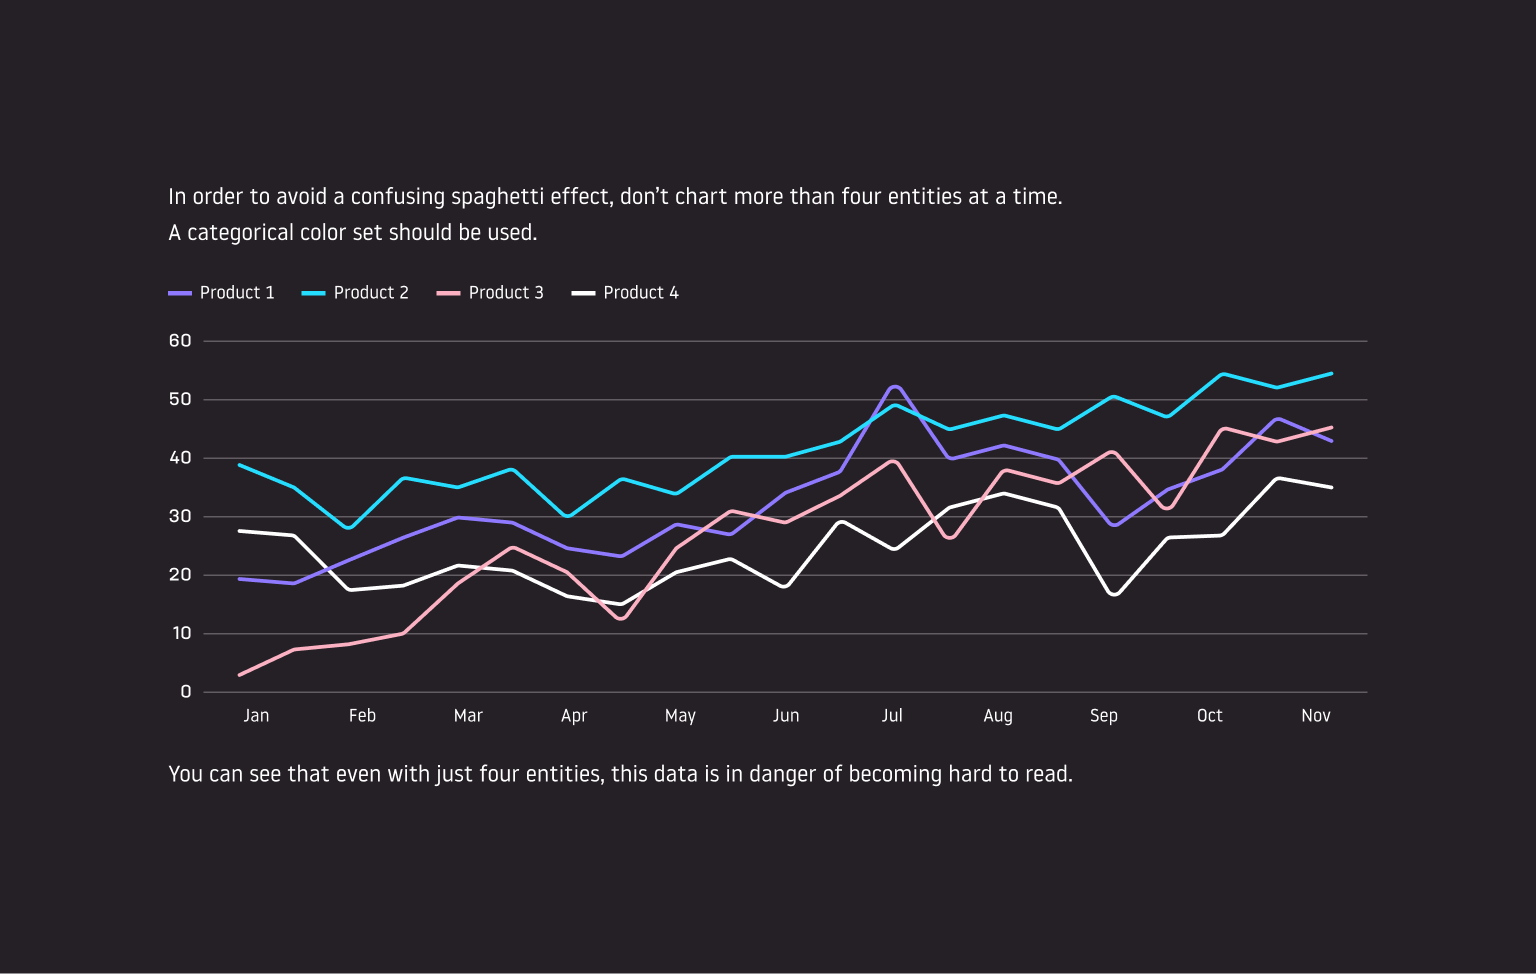
The color system developed for data visualization might be just as complicated as a design system’s foundational color set. This is primarily because, while color can be a great aid in understanding a chart, not all people see colors the same. In order to deliver a chart that all viewers can see equally, contrasting brightness values are more important, functionally, than hues.
Even something as seemingly black and white as data charts can be manipulated and used, either intentionally or unintentionally, to mislead rather than inform. This is why guidelines such as these are so important.